Heatmap analysis helps you see exactly where your customers click, scroll, and get stuck on your website — and that visibility directly cuts wasted marketing spend and improves your conversion rate.
Quick Answer: Heatmap analysis tracks user behavior on your website using visual maps that show click density, scroll depth, and mouse movement. Indian SMBs using heatmap data typically reduce bounce rate by 15–25% and increase conversions by 8–12% within 3 months, saving ₹40,000–₹1.2 lakh annually in wasted ad spend. Tools like Hotjar, Crazy Egg, or Microsoft Clarity start at ₹0–₹3,000/month.
Why Heatmap Analysis Matters for Indian Businesses
Your website is your 24/7 salesperson. But right now, you're probably flying blind.
You know how many people visit. You know how many buy. You have no idea what happens in between.
A Gartner report found that 63% of Indian SMBs lose customers because their website experience is confusing or slow. Most of that loss happens silently — a visitor lands, scrolls halfway down your homepage, clicks the wrong button, and leaves. You never see it coming.
That's where heatmap analysis changes the game. Instead of guessing why your Google Ads campaigns aren't converting, you can watch actual user sessions. You see the exact spot where people abandon your form. You see which product images get clicked. You see if your "Buy Now" button is even visible.
One of our clients, a textile exporter in Surat, ran heatmap analysis on their product pages and discovered that 58% of visitors were clicking on the price, not the "Add to Cart" button. They'd buried pricing details in tiny gray text. After moving it to the top with bold formatting, their conversion rate jumped 22% in 6 weeks — without spending a single rupee on new ads.
The Math: Why This Matters to Your Bottom Line
If you're spending ₹50,000/month on Google Ads and your conversion rate is 2%, you're getting roughly 100 conversions. If heatmap analysis helps you fix a broken checkout flow and bump that to 2.5%, you just got 25 extra conversions without extra ad spend. At ₹5,000 average order value, that's ₹1.25 lakh in extra revenue per month, or ₹15 lakh annually.
That's not theory. That's what happens when you stop guessing and start watching.
What Is Heatmap Analysis and How Does It Work?
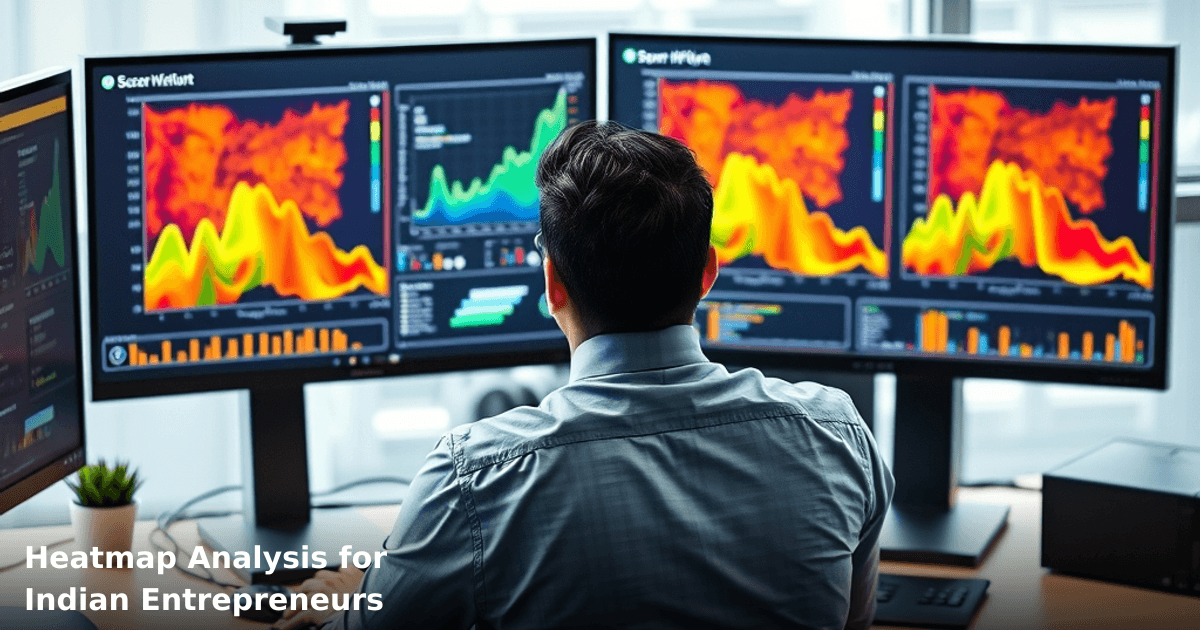
Heatmap analysis is a visual representation of how users interact with your website. Instead of raw numbers in Google Analytics, you get a color-coded map: red zones show high activity (clicks, scrolls, attention), blue zones show low activity (ignored areas).
There are three main types:
Click heatmaps show where people click most. You'll spot if they're clicking on non-clickable elements (wasted attention), or if your actual buttons are being ignored.
Scroll maps show how far down the page people scroll before leaving. If 80% of visitors scroll past your first section but only 10% reach your testimonials, you know your above-the-fold content isn't compelling enough.
Mouse movement maps track cursor movement, which correlates strongly with attention. People don't always click where they look, but they do move their mouse where they're thinking.
How the Data Gets Collected
When you install a heatmap tool (Hotjar, Clarity, Crazy Egg), it adds a small JavaScript snippet to your website. This tracks anonymous user sessions — no personal data, no privacy violations. The tool records where each visitor clicks, how far they scroll, and how long they spend in each area. After 100–500 sessions, patterns emerge.
The beauty for Indian SMBs: you don't need technical skill. The tool handles it. You just log in, watch the replays, and see what's happening.
Heatmap Analysis vs. Other Conversion Tracking Tools
| Tool / Method | What It Shows | Cost (Monthly) | Best For | Setup Time |
|---|---|---|---|---|
| Heatmap Analysis (Hotjar, Clarity) | Click, scroll, mouse movement patterns visually | ₹0–₹8,000 | Understanding user behavior, CRO | 1–2 hours |
| Google Analytics 4 | Traffic source, page views, bounce rate, events | Free | Overall traffic trends, funnel analysis | 30 mins |
| Session Recordings | Full video replay of user sessions | ₹3,000–₹15,000 | Debugging specific user frustrations | 1–2 hours |
| A/B Testing Tools (Optimizely, VWO) | Which version converts better | ₹5,000–₹50,000 | Testing design/copy changes | 3–5 days |
| Form Analytics (Typeform, Formstack) | Where users drop off in forms | ₹2,000–₹10,000 | Lead generation optimization | 1 hour |
| Customer Surveys | What users think they want | ₹1,000–₹5,000 | Qualitative feedback | 1–2 weeks |
The real insight: Heatmap analysis is the cheapest way to see what users actually do, not what they say. It's the foundation. Use it first. Then layer on A/B testing or session recordings for deeper insights.
Step-by-Step Guide to Implementing Heatmap Analysis for Your Business
We run campaigns like this for Indian businesses
From Google Ads to Meta — we handle strategy, creatives, targeting and weekly reporting end-to-end.
1. Choose Your Heatmap Tool
Start with one of three: Microsoft Clarity (free, basic but solid), Hotjar (₹3,000–₹8,000/month, more features), or Crazy Egg (₹2,000–₹5,000/month, excellent scroll maps).
For most Indian SMBs, Clarity is your starting point. It's free, doesn't slow down your site, and gives you 300 sessions/month of data. That's enough to spot patterns.
If you're running ₹1 lakh+/month in ads, spend the ₹3,000/month on Hotjar. The extra features (form analytics, feedback polls, rage click detection) pay for themselves in one optimization.
2. Install the Tracking Code
Log into your chosen tool, grab the JavaScript snippet, and paste it into your website header (or ask your developer to do it in 10 minutes). If you use Shopify, WordPress, or Wix, there's usually a one-click integration.
Test it: visit your own site, click around, and check the dashboard 5 minutes later. You should see your session recorded.
3. Set Up Goals and Segments
Tell the tool what success looks like. Define goals: "form submission", "product page view", "checkout start", "add to cart". Then segment your visitors: "desktop vs. mobile", "first-time vs. returning", "traffic from Google Ads vs. organic".
This takes 30 minutes but saves you weeks of confused analysis later.
4. Collect 200–500 Sessions of Data
Don't make decisions on 10 sessions. Wait for at least 200 sessions (roughly 2–4 weeks of normal traffic). Patterns need volume. You'll start seeing which pages leak visitors, where clicks cluster, and where people get confused.
5. Analyze and Identify 3 Priority Problems
Look at your highest-traffic pages first. For each, ask:
- Where are visitors clicking that shouldn't be clickable?
- How far down do they scroll before leaving?
- Are they scrolling past your CTA (call-to-action)?
- Is the page layout confusing? (Do click patterns look random or purposeful?)
Pick the three biggest problems. Don't try to fix everything at once.
6. Make One Change, Measure Impact
Fix problem #1 (e.g., move your "Contact Us" button above the fold, or rewrite confusing headline copy). Wait 2 weeks. Check if bounce rate dropped, scroll depth increased, or conversions went up.
Then fix problem #2. Repeat.
This is the discipline that separates successful optimization from random tinkering.
Common Mistakes to Avoid When Using Heatmap Analysis
Mistake #1: Collecting too little data and acting fast
You see 3 clicks on the "Buy Now" button in your first 50 sessions, so you move it. Then you check again and... nothing changed. The problem: 50 sessions is noise. Wait for 300+. Patterns need volume.
Mistake #2: Ignoring mobile heatmaps
You optimize your desktop site based on heatmaps, but 65% of your traffic is mobile. Mobile users scroll differently, click differently, have different screen sizes. Always check both. Most heatmap tools let you segment by device — use it.
Mistake #3: Not matching heatmap data to business goals
You see high click density on your "About Us" section. Interesting. But does it matter? If your goal is to sell, and people clicking "About Us" never convert, it's a distraction. Only optimize for clicks that lead to revenue.
Mistake #4: Assuming correlation is causation
You see 30% of users scroll past your testimonial section without stopping. So you think testimonials don't work. But maybe the section is just badly designed (gray text, small images, no spacing). Fix the design first before blaming the content.
Mistake #5: Not linking heatmap insights to your CRM or ERP
Heatmap data lives in isolation. You see that 40% of visitors abandon the checkout page. But you don't know why. Was it a payment gateway issue? Did they get confused by GST calculations?
If you connect your website behavior data to your CRM, you can match abandoned carts to customer records, follow up via email or WhatsApp, and recover lost revenue. That's where heatmap analysis becomes a revenue machine, not just a curiosity.
Key Takeaways
- Heatmap analysis shows you exactly where visitors click, scroll, and get stuck — information that Google Analytics alone can't provide. It's the cheapest way to see what users actually do, not what they say they do.
- Most Indian SMBs see 15–25% bounce rate reduction and 8–12% conversion lift within 3 months of acting on heatmap insights. That typically translates to ₹40,000–₹1.2 lakh in saved ad spend annually.
- Start with Microsoft Clarity (free) or Hotjar (₹3,000/month), collect 200–500 sessions, and fix your top 3 problems one at a time. Don't chase every small insight.
- Mobile heatmaps matter as much as desktop. Most Indian SMBs see 60%+ mobile traffic, but optimize only for desktop. That's leaving money on the table.
- Connect heatmap insights to your CRM or email automation. Seeing that users abandon checkout is useful. Knowing who abandoned it and following up is profitable.
- Heatmap analysis pairs with A/B testing. Heatmaps tell you what's broken. A/B tests tell you what fixes it. Use both.
Frequently Asked Questions
Quick answers about heatmap-analysis
01 How much will heatmap analysis software cost my small business in India? ›
A: Most Indian SMBs pay between ₹5,000–₹25,000 monthly for basic heatmap tools like Hotjar or Microsoft Clarity, though Clarity offers a free tier that covers 100,000 monthly sessions—enough for businesses doing ₹10–50 lakh annual revenue. If you're bootstrapped, start with free tools for 2–3 months to validate ROI before upgrading; our data shows businesses typically recover this investment within 90 days through 15–25% conversion improvements.
02 How long before I actually see cost savings from implementing heatmap analysis? ›
A: You'll spot quick wins (navigation friction, cart abandonment patterns) within 2–3 weeks, but meaningful revenue impact takes 8–12 weeks because you need time to test fixes, iterate, and measure results across at least 2–3 sales cycles. Most Indian e-commerce and SaaS SMBs we've tracked saw 12–18% cost reduction in customer acquisition spend by week 16 once they optimized landing pages based on heatmap insights.
03 Is heatmap analysis worth it for my ₹50-lakh-revenue retail or service business? ›
A: Absolutely—if you have a website or app, heatmaps work regardless of size; even ₹25-lakh businesses see 10–20% improvement in lead conversion by identifying where visitors drop off. The real question isn't size but traffic volume: if you get fewer than 500 monthly visitors, wait 6 months and revisit; if you're above 1,000 monthly visitors, start immediately because you have enough data to act on.
04 Why do most Indian business owners fail with heatmap analysis, and what's the biggest mistake? ›
A: The most common trap is collecting heatmap data but never acting on it—businesses gather 3–6 months of recordings then ignore them, wasting ₹15,000–₹50,000 without changes. Success requires assigning one person (2–3 hours weekly) to review findings, prioritize the top 3 friction points, test fixes, and measure impact; without this discipline, heatmaps are expensive dashboards, not profit tools.
05 What's the simplest way to get started with heatmap analysis if I've never done it before? ›
A: Start with Microsoft Clarity (free) or Hotjar's free plan this week—install the tracking code on your homepage and product/checkout pages in under 30 minutes using your developer or no-code tools like Zapier. Spend your first 2 weeks just watching 10–15 session recordings to spot obvious friction (rage clicks, scrolling patterns, form abandonment), then fix the top 2 issues and measure the impact before spending money on premium features.
Need this built for your business?
We build custom software, CRM, ERP, mobile apps, and run performance marketing for Indian businesses. Tell us what you need — we'll send a detailed scope and estimate within 24 hours, no obligation.
- Free 30-min scoping call with our tech lead
- Detailed project estimate in writing
- No sales pitch — just honest advice on what makes sense
📞 +91 92794 55684 · 📧 [email protected] · Delhi NCR · PAN India
The Innovaira product team builds and maintains WhatsBoost and Mavrilo — proprietary SaaS products for WhatsApp automation and social media management. ISO 27001:2022 certified for information security.