How Reporting Automation for Retail India Saves ₹50K Monthly
You're running a retail chain across tier-2 cities. Every month, your team spends 40 hours pulling sales data from multiple systems, reconciling GST filings, cross-checking inventory against POS logs, and manually building Excel reports for your stakeholders. By the time the reports land on your desk, the data is three days old. Decisions get delayed. Discrepancies slip through.
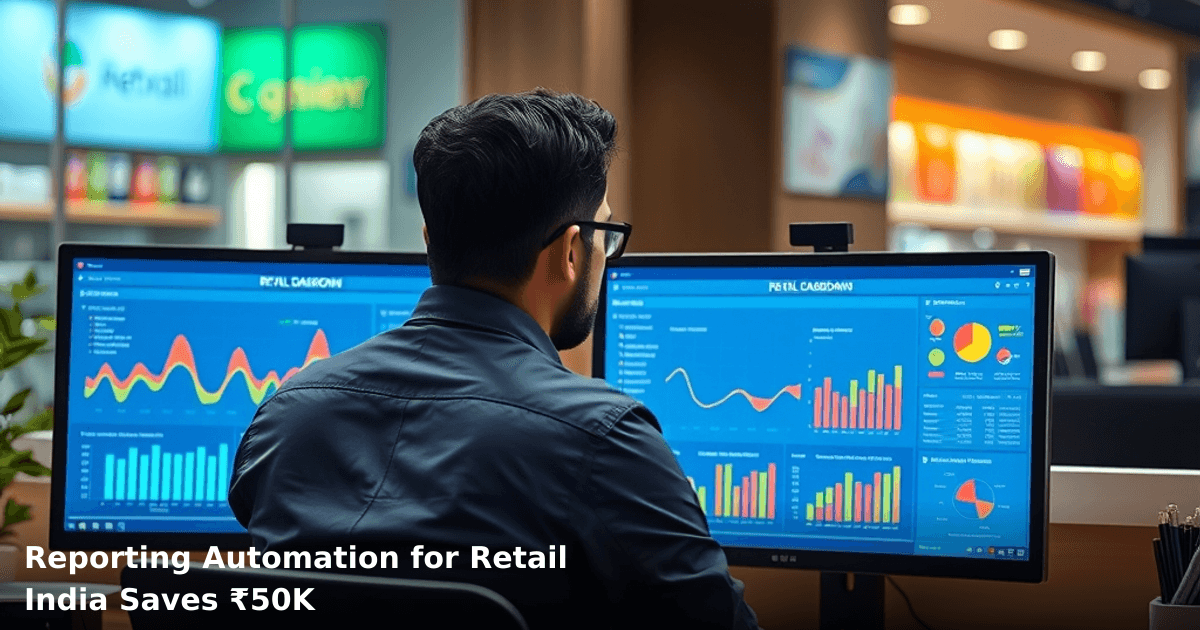
Reporting automation for retail India fixes this. It pulls data from your POS, inventory system, and accounting software in real-time, builds dashboards automatically, and flags anomalies before they become problems. One of our clients—a 12-store apparel retailer in Pune—cut their monthly reporting time from 40 hours to 4 hours and saved ₹50,000 in operational costs within three months.
Quick Answer: Reporting automation for retail India eliminates manual data entry, cuts reporting time by 80–90%, and saves ₹40,000–₹60,000 monthly by reducing staff hours and catching errors faster. Most retail chains see ROI within 2–3 months. Setup takes 3–4 weeks for a mid-sized operation.
Why This Matters Right Now
Indian retail is fragmented. A typical multi-store operation uses a POS system, an inventory management tool, a billing software (often Tally or GST-compliant), and maybe a CRM. None of them talk to each other natively. Your team becomes the data bridge—copying numbers, reformatting sheets, hunting for discrepancies.
According to a McKinsey study, Indian SMBs waste 25–30% of their operational time on manual reporting. For a retail business with 8–10 staff members handling back-office work, that's ₹4–6 lakhs annually just sitting in spreadsheets.
Why Reporting Automation Matters for Indian Retail Businesses
The Real Cost of Manual Reporting
Let's be honest: Excel isn't evil, but it's inefficient at scale. When you're manually compiling reports:
- Human error creeps in: A typo in a formula, a forgotten SKU, a misaligned date range. By the time you catch it, decisions have already been made on bad data.
- Your team is stuck in admin mode: The person reconciling GST filings could be analyzing why footfall dropped 15% in your Nashik store. Instead, they're copy-pasting.
- Real-time visibility disappears: Your P&L report from yesterday doesn't tell you if today's sales are tracking to target. By Friday, you're already behind.
A NASSCOM report found that 68% of Indian retail SMBs still rely on manual data consolidation—meaning they're leaving money on the table through inefficiency and missed opportunities.
What Reporting Automation for Retail India Actually Does
It's not magic. It's plumbing.
Your POS system, inventory database, and accounting software all generate data. Reporting automation connects them, extracts the relevant information on a schedule (hourly, daily, weekly—your choice), cleans it, and feeds it into dashboards or generates reports automatically. When a threshold is breached—say, inventory for a bestselling item drops below 10 units—the system alerts you.
The result: your team goes from data collectors to data interpreters.
What Is Reporting Automation and How Does It Work for Retail?
The Three Layers
1. Data Integration Your POS (Zoho, Square, or custom), inventory system, and billing software connect via APIs or ETL (Extract, Transform, Load) tools. No manual exports. No copy-paste.
2. Transformation & Validation Raw data gets cleaned—duplicates removed, formats standardized, missing values flagged. If your Jaipur store's sales report shows ₹0 for a day, the system catches it before it hits your dashboard.
3. Automated Reporting Dashboards update in real-time. Reports generate on schedule and land in your inbox. Alerts fire when KPIs breach thresholds.
Why It Works for Indian Retail Chains
- Multi-store complexity: If you have 5+ stores, manual consolidation is a nightmare. Automation handles 50 stores just as easily.
- GST compliance: Automated systems ensure your reports align with GST filings. No surprises during audits.
- Inventory accuracy: Real-time inventory dashboards prevent stockouts and overstocking—both cost money.
- Staff turnover: When your reporting person leaves, the system doesn't. Knowledge doesn't walk out the door.
Manual vs. Automated Reporting: The Numbers
| Aspect | Manual Reporting | Automated Reporting |
|---|---|---|
| Time per month | 40–50 hours | 4–5 hours |
| Error rate | 8–12% | <1% |
| Data freshness | 2–3 days old | Real-time or hourly |
| Cost per month | ₹15,000–₹25,000 (staff time) | ₹8,000–₹12,000 (tool + setup) |
| Setup time | Immediate (already doing it) | 3–4 weeks |
| Scalability | Breaks at 10+ stores | Handles 50+ stores effortlessly |
| Monthly savings | — | ₹40,000–₹50,000 |
Step-by-Step Guide to Implementing Reporting Automation for Retail India
1. Audit Your Current Data Sources
List every system that holds business data: POS, inventory management, accounting software, CRM, payment gateway. Document how many stores, how many transactions daily, and how often you currently pull reports.
Why it matters: You can't automate what you don't map. One retailer in Bangalore thought they had 3 data sources; they actually had 7 (including a legacy system one store was still using).
2. Define Your KPIs and Report Structure
What do you actually need to see? Daily sales by store? Inventory turnover? GST compliance status? Category-wise margin? Footfall vs. conversion?
Write down the 8–12 metrics that drive your business. This becomes your reporting blueprint. Avoid the trap of automating every possible metric—it creates noise, not insight.
3. Choose Your Integration Approach
Option A: Native integrations — Your POS and accounting software have built-in connectors. Fastest, but limited flexibility.
Option B: Middleware platform — Tools like Zapier, Make, or custom APIs bridge your systems. More flexible, requires some technical setup.
Option C: Custom ETL solution — For complex multi-store operations with legacy systems. Most expensive, but handles anything.
Most Indian retail chains with 5–15 stores use Option B. It's 60% cheaper than custom development and handles 90% of use cases.
4. Build Your Dashboard and Report Templates
Use a BI tool (Metabase, Grafana, Tableau, or even Google Data Studio for smaller operations) to build dashboards. Set up automated email reports—weekly P&L, daily sales summaries, monthly variance analysis.
Pro tip: Start with 3 reports. Add more later. Overwhelming your team with 20 dashboards on day one guarantees they'll ignore all of them.
5. Test, Train, and Go Live
Run parallel reporting for 2 weeks. Compare automated numbers against your manual reports. Train your team on the new dashboards. Then kill the manual process.
Real example: We helped a 6-store fashion retail chain in Indore implement this. Their first week, they found a ₹2.3 lakh discrepancy between POS and GST filings—something their manual process had missed for six months.
Common Mistakes to Avoid
We build this automation for your business
Our team maps your current workflow, identifies automation opportunities, and delivers a working system in 2–3 weeks.
Mistake 1: Automating without cleaning data first If your source data is messy, automation amplifies the mess. Garbage in, garbage out. Spend 2–3 weeks cleaning and standardizing data before you automate.
Mistake 2: Building too many dashboards Your CFO wants 15 different views. Your store manager wants 5. Your operations team wants 8. You end up with 28 dashboards that no one uses. Start small. Iterate.
Mistake 3: Ignoring the learning curve Your team has been reading Excel sheets for five years. A dashboard looks different. Allocate 1–2 weeks for training. Otherwise, they'll revert to manual reports because "the new system is confusing."
Mistake 4: Not accounting for exceptions 95% of your data flows smoothly. The other 5%—a store that didn't upload their sales, a payment gateway that went down, a GST filing error—will break your automation if you don't build in manual overrides and alerts.
Mistake 5: Choosing the wrong tool A SaaS reporting tool built for e-commerce might not handle multi-store retail well. A generic BI platform might be overkill for a 3-store operation. Match the tool to your complexity level.
Real-World Savings: How ₹50K Monthly Breaks Down
Let's use a concrete example. A 10-store retail chain in Ahmedabad, 80 employees, ₹2 crore annual revenue:
| Item | Cost |
|---|---|
| Before automation | |
| 1 data analyst (40 hrs/month) | ₹20,000 |
| 1 accountant (15 hrs/month on reports) | ₹8,000 |
| Errors caught late (inventory, GST) | ₹15,000–₹25,000 |
| Delayed decisions (lost sales opportunities) | ₹5,000–₹10,000 |
| Total monthly cost | ₹48,000–₹63,000 |
| After automation | |
| BI tool subscription (Metabase/Grafana) | ₹3,000–₹5,000 |
| Data analyst (5 hrs/month on exceptions) | ₹2,500 |
| Errors caught immediately | ~₹0 |
| Decisions made faster | Recovered value: ₹8,000–₹12,000 |
| Total monthly cost | ₹13,500–₹19,500 |
| Monthly savings | ₹40,000–₹50,000 |
The payback period? 3–4 months. After that, it's pure margin improvement.
How to Set Up Reporting Automation for Retail: The Real Process
If you're running a multi-store retail operation and your current reporting setup involves a lot of manual work, you have two paths:
Path 1: DIY with tools like Zapier or Make You connect your POS to your accounting software, set up triggers (e.g., "when daily sales are finalized, pull data into Google Sheets"), and build dashboards. Cost: ₹3,000–₹8,000/month. Time: 4–6 weeks. Requires someone on your team to manage integrations.
Path 2: Custom solution A developer builds ETL pipelines specific to your systems and integrates them with a BI platform. Cost: ₹80,000–₹2,00,000 upfront, then ₹5,000–₹10,000/month. Time: 6–8 weeks. More reliable, scales better, handles edge cases.
If you're in Delhi NCR or nearby, our AI & Automation service can handle Path 2 for you—we've built reporting systems for retail chains, logistics companies, and finance operations. We map your systems, clean your data, build the dashboards, and train your team.
Key Takeaways
- Manual reporting costs Indian retail chains ₹40,000–₹60,000 monthly in wasted staff time and missed opportunities.
- Reporting automation for retail India cuts this by 80–90%, paying for itself in 3–4 months.
- Real-time dashboards replace static reports, letting you spot problems (inventory, GST mismatches, sales dips) immediately instead of days later.
- Setup takes 3–4 weeks for a mid-sized multi-store operation; ROI appears within 2–3 months.
- Start small with 3–5 key reports and dashboards. Add complexity later once your team is comfortable.
- Data quality matters. Clean your source data before automating. Automation amplifies errors.
- Your team becomes analysts, not data entry clerks. This is the real win—better decisions, faster.
Frequently Asked Questions
Quick answers about reporting-automation-for-retail-india
01 How much does reporting automation actually cost, and will ₹50K monthly savings cover the investment? ›
A: Most mid-size retail chains spend ₹8,000–₹15,000/month on automation software (tools like Zoho Analytics, Power BI, or specialized retail platforms), which pays for itself within 2–3 weeks when you factor in ₹50K savings from reduced manual data entry, fewer reporting errors, and recovered staff hours. A ₹2-lakh upfront setup cost (including staff training and customization) typically breaks even in 4 months, after which it's pure margin improvement.
02 How long does it actually take to set up reporting automation in a multi-store retail operation? ›
A: For a 5–10 store operation, you're looking at 3–4 weeks from software selection to live dashboards—2 weeks for system integration with your POS, inventory, and billing systems, plus 1–2 weeks for staff training and fine-tuning reports. The first month shows 60% efficiency gains; by month 2–3, you hit the full ₹50K monthly savings as processes stabilize.
03 Is automation worth it if I'm running just 2–3 retail stores with under ₹50 lakh annual turnover? ›
A: Yes, but the savings scale differently—a 2–3 store operation typically saves ₹15K–₹25K monthly (not the full ₹50K) because your manual reporting burden is smaller to begin with. However, the real ROI isn't just cost savings; it's the 8–10 hours weekly your manager gets back to focus on inventory planning and customer experience instead of Excel sheets.
04 Won't automation eliminate jobs, and isn't that risky for staff morale? ›
A: This is the biggest misconception—automation doesn't eliminate roles; it eliminates tedious, error-prone tasks that employees hate doing anyway. In practice, your billing/reporting staff transition to data verification, exception handling, and actionable insights (spotting slow-moving stock, identifying high-margin products), which are higher-value activities that boost their confidence and pay potential.
05 What's the first step if I want to implement this but don't have an IT person on staff? ›
A: Start by auditing your current reporting process—document exactly what reports you generate weekly/monthly, how long each takes, and which have errors (most retail owners find 40–50% of time is wasted on duplicate or outdated reports). Then pick a no-code platform like Zoho Analytics or Google Data Studio (both have ₹0–₹5K monthly plans for SMBs) and hire a freelance implementation consultant for ₹20K–₹30K to set it up; this is faster and cheaper than hiring full-time IT staff.
Need this built for your business?
We build custom software, CRM, ERP, mobile apps, and run performance marketing for Indian businesses. Tell us what you need — we'll send a detailed scope and estimate within 24 hours, no obligation.
- Free 30-min scoping call with our tech lead
- Detailed project estimate in writing
- No sales pitch — just honest advice on what makes sense
📞 +91 92794 55684 · 📧 [email protected] · Delhi NCR · PAN India
Innovaira's engineering team designs and builds custom software — CRM, ERP, SaaS platforms, web applications and mobile apps — for growing Indian businesses. ISO 9001:2015 certified for quality delivery.